Reinvesting for Growth - Why Amazon.com, Inc. (NASDAQ:AMZN) is Undervalued Even in this Market
This article first appeared on Simply Wall St News
Ever since Amazon.com, Inc. (NASDAQ:AMZN) entered its latest bull run in the middle of 2020, investors have been wondering if the company is still attractive. In this article, we will go over some key drivers for future growth and see why the company can increase in value.
How is Amazon Growing
In order for a company to grow it must reinvest into the business. Generally, growth can be broken down into 2 variables:
How much a company reinvests
How well/smart do they do it (from idea to execution)
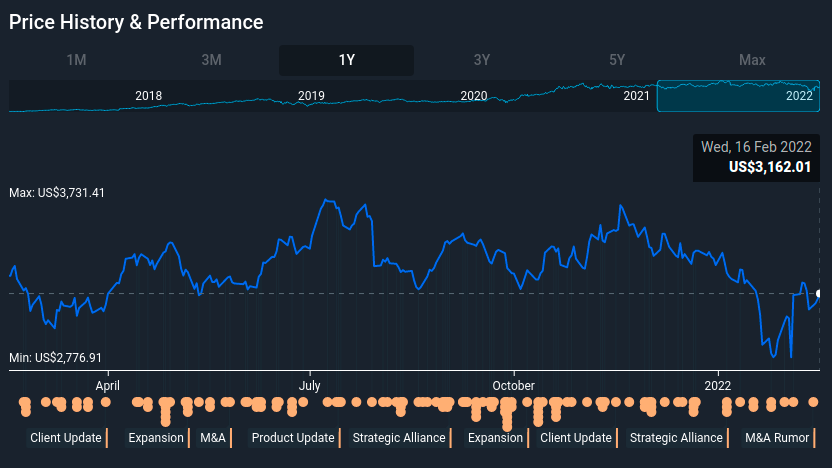
With that in mind, I checked the latest developments in Amazon over the last year, and as we will see in the chart below, the company has been extremely agressive:
The orange dots below the stock pirice are notable developments that Amazon has engaged in, or that have been reported from 3rd sources. Most of these developments are centered around the growth and expansion of the business, and their effect should be felt in the future.
If you want to see a summary of every event from the chart above, go to Amazon's profile and click on any dot of interest - You can also zoom in to a 3 month view for better readability.
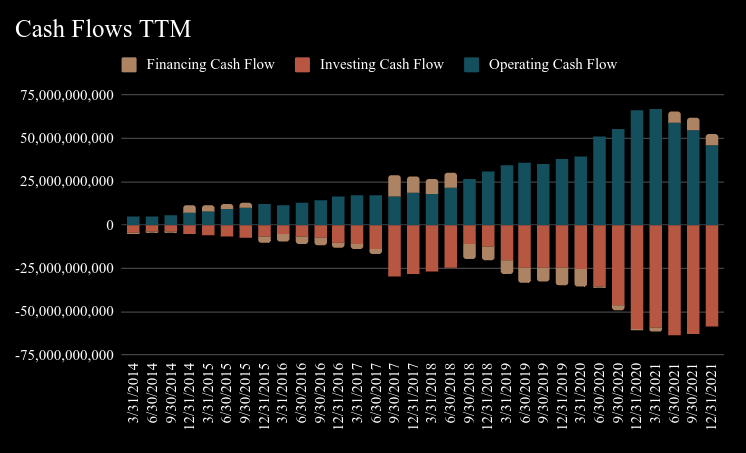
Next, we need to see how much capital is Amazon putting behind these developments, and growth in general. We can do that by looking at the cash flow statement.
There, we have an item that shows how much cash the company spent on investments, including capital expenditures!
Let's break this chart down.
There are 3 main types of cash flows: Cash flowing from operating activities (what the company sells, after expenses), cash from financing (taking a loan, selling stock, etc), and the focus of our analysis, cash from investing (buying other companies, equipment, infrastructure, IP's, etc).
The cash flow statement shows as positive (+), how much cash entered the company, and as negative (-), how much cash is being spent.
In the case of a growing company like Amazon, spending cash is not necessarily a bad thing, as that cash is actually being invested into the long-term development of the business.
If you go to the past section for Amazon, you can click to see the cash from operations, while the difference between cash from operations and free cash flows are the capital expenditures (a close approximation for cash from investing).
We can see that Amazon invested US$58b in the last 12 months, while it gained $46b from operations and $6.2b from financing. This means that the company is still quite aggresive on growth and is investing more than it is making. In the case of Amazon, this is not a problem, as the company has more than enough financing capacity to cover these expenses.
While we covered cash from investing, there is one more aspect to consider. Amazon does a fair bit of R&D, and is seems that a good part of it will result in growth on the long term. If we wanted to count R&D expenses, which in the case of Amazon seems justified. We need to capitalize them and calculate the value of R&D. With that in mind, the value of the last three years is US$96.5b (straight line depreciation), with US$56b spent in the last 12 months.
This means, that a more realistic measure of how much Amazon is investing in growth are the cash flow from investing + R&D, resulting in US$154.7b of investments.
The amount a company invests will help us estimate their revenue growth potential!
First, we take the capital invested in the company: Equity + Debt (including leases) - Cash + Value of R&D + Reinvestments
Capital Invested: $138.3 + $116.3 - $96 + $154.7 = $313.3b
And then we can multiply by what the company has been making in revenue on that capital. This is the quality of descision making lever. For AMZN, it has been between 1.63 and 1.9 in the last 4 quarters ttm, we will go with the most recent value of 1.84.
Now that we know how much the company has invested, and what it makes on revenues from those investments, we can calculate a fundamental revenue growth rate.
We get: 313.3 * 1.84 = $576.5b estimated revenues next year
Finally to get the estimated Annual Growth we need to: 576.5 / 469.8 - 1 = 21.8%
(Estimated revenue next year / Last ttm Revenue - 1)
According to how much Amazon reinvests into the business, and how smart these investments have been in the past, we can expect to see some 20% growth. Note that there are some moving parts, and the analysis is quite subjective - for example, management can make mistakes or better descisions, and this will impact the rate.
Alternatively, instead of cash flows from investing activities, we can just use Capital Expenditures. In that case we would get a revenue growth of 23.8% for the next 12 months.
The Valuation
Growth is great, but for investing we need to tie that into value, and see if it is worth digging deeper into the company.
For that we can take advantage of the Discounted Cash Flow (DCF) model. This attemts to estimate the value of a company, by adding up the present value of all of the cash it will generate in the future. However, a DCF is just one valuation metric among many, and it is not without flaws.
View our full analysis for Amazon.com
To begin with, we have to get estimates of the next ten years of cash flows.
Where possible we use analyst estimates, but when these aren't available we extrapolate the previous free cash flow (FCF) from the last estimate.
A DCF is all about the idea that a dollar in the future is less valuable than a dollar today, so we need to discount the sum of these future cash flows to arrive at a present value estimate:
10-year free cash flow (FCF) estimate
2022 | 2023 | 2024 | 2025 | 2026 | 2027 | 2028 | 2029 | 2030 | 2031 | |
Levered FCF ($, Millions) | US$37.6b | US$55.4b | US$81.9b | US$104.9b | US$128.8b | US$146.5b | US$161.4b | US$173.8b | US$184.2b | US$193.0b |
Growth Rate Estimate Source | Analyst x14 | Analyst x14 | Analyst x6 | Analyst x4 | Analyst x4 | Est @ 13.73% | Est @ 10.19% | Est @ 7.71% | Est @ 5.97% | Est @ 4.75% |
Present Value ($, Millions) Discounted @ 6.4% | US$35.3k | US$48.9k | US$68.0k | US$82.0k | US$94.6k | US$101.2k | US$104.8k | US$106.2k | US$105.8k | US$104.2k |
("Est" = FCF growth rate estimated by Simply Wall St)
Present Value of 10-year Cash Flow (PVCF) = US$851b
After calculating the present value of future cash flows in the initial 10-year period, we need to calculate the Terminal Value, which accounts for all future cash flows beyond that.
Present Value of Terminal Value (PVTV)= TV / (1 + r)10= US$4.4t÷ ( 1 + 6.4%)10= US$2.4t
The total value, or equity value, is then the sum of the present value of the future cash flows, which in this case is US$3.2t.
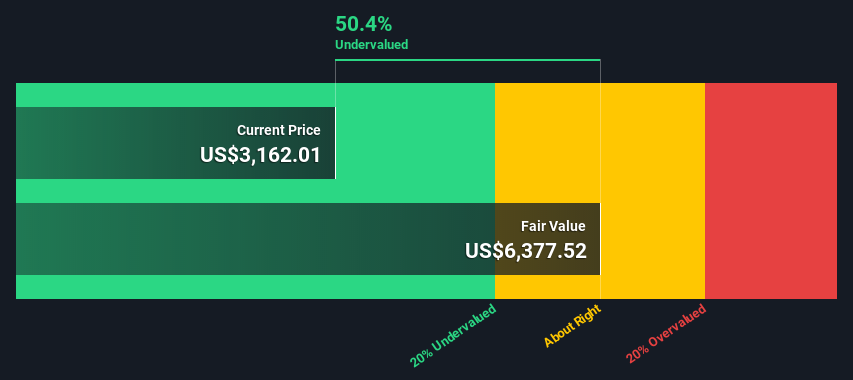
Relative to the current share price of US$3.2k, the company appears reasonably undervalued at a discount of 50%.
While this might sound a bit over the top, we can assume that the company is still significantly undervalued, and encourege investors to dig deeper - In fact why not test out a model youself with our tool.
The assumptions in any calculation have a big impact on the valuation, so it is better to view this as nothing more than a rough estimate.
Key Takeaways
In this article we explored why re-investing is crucial for the growth of Amazon, and saw that the company is very agressive with new investments into the business.
We estimated a revenue growth rate of around 22%, and paired it with analysts forecasts.
At the end, the goal is to see if a company is undervalued, so we took the forecasts from analysts and used them to get a rough estimate of intrinsic value.
It seems that the company is still on the expansion track, and the investments will create value for investors in the future.
Have feedback on this article? Concerned about the content? Get in touch with us directly. Alternatively, email editorial-team@simplywallst.com
Simply Wall St analyst Goran Damchevski and Simply Wall St have no position in any of the companies mentioned. This article is general in nature. We provide commentary based on historical data and analyst forecasts only using an unbiased methodology and our articles are not intended to be financial advice. It does not constitute a recommendation to buy or sell any stock and does not take account of your objectives, or your financial situation. We aim to bring you long-term focused analysis driven by fundamental data. Note that our analysis may not factor in the latest price-sensitive company announcements or qualitative material.


