Category:Statistics
Jump to navigation
Jump to search

| Category Statistics on sister projects: | |||||||||
|---|---|---|---|---|---|---|---|---|---|
Wiktionary |
Wikiquote |
Wikibooks |
Wikisource |
Wikiversity | |||||
study of the collection, analysis, interpretation, and presentation of data  | |||||
| Upload media | |||||
| Instance of |
| ||||
|---|---|---|---|---|---|
| Subclass of | |||||
| Part of | |||||
| Has part(s) |
| ||||
| Different from | |||||
| |||||
Resources:
Subcategories
This category has the following 45 subcategories, out of 45 total.
*
?
A
- Anscombe's quartet (16 F)
B
- Bias (statistics) (3 F)
C
- Cross-validation (statistics) (17 F)
D
F
- Forest plots (6 F)
H
I
L
M
O
- Operating characteristics (4 F)
P
- Procrustes analysis (8 F)
- Statistical proof (1 F)
S
- Structural equation modeling (6 F)
- SVG statistics (35 F)
T
- Tor project statistics (6 F)
V
Media in category "Statistics"
The following 200 files are in this category, out of 1,261 total.
(previous page) (next page)-
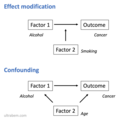 Confounding modification.png 1,988 × 2,016; 190 KB
-
 Confusion matrix.png 1,557 × 805; 82 KB
-
 Constant hazard table.png 594 × 259; 8 KB
-
 Contingency Table.png 1,204 × 281; 14 KB
-
 Continuous event space specification.svg 517 × 216; 17 KB
-
 Continuous optimal transport.png 824 × 300; 968 KB
-
 Cookie anova model 1.png 309 × 121; 3 KB
-
 Cookie anova model 2 v 2.png 406 × 127; 4 KB
-
 Cookie anova model 2.png 404 × 125; 4 KB
-
 CornishFisherValidity.svg 1,044 × 661; 82 KB
-
 CorrelationIconography.png 480 × 444; 8 KB
-
 Correlations-codons-GC-DRNA-ccg.png 756 × 425; 68 KB
-
 CoverageError.jpg 430 × 279; 31 KB
-
 CPCs.png 640 × 289; 97 KB
-
 CPGrandensemble.PNG 280 × 196; 9 KB
-
 Critical correlation vs. sample size.svg 723 × 405; 20 KB
-
 Cross-country-literacy-rates.svg 850 × 600; 27 KB
-
 Cuadro de votos.jpg 415 × 271; 29 KB
-
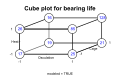 Cube plot for bearing life.svg 538 × 341; 73 KB
-
 CumCalc.png 419 × 514; 48 KB
-
 CumList.png 363 × 649; 55 KB
-
 Cumulative dollars rate changes.svg 356 × 355; 63 KB
-
 Cumulative dollars.svg 356 × 355; 55 KB
-
 Cumulative frequency graph with quartiles marked.jpg 2,654 × 1,703; 203 KB
-
 Cumulative frequency graph.jpg 2,303 × 1,503; 147 KB
-
 Curva de bañera.jpg 571 × 338; 26 KB
-
 D-Vine, 4 variables.png 619 × 291; 14 KB
-
 Dalton-Index.png 1,301 × 1,301; 53 KB
-
 Data points on graph.png 800 × 800; 32 KB
-
 Data structure.png 2,308 × 1,170; 146 KB
-
 David Helliwell (The English National Football Archive).png 781 × 294; 19 KB
-
 De Moivre 1725 page 25.jpg 601 × 296; 34 KB
-
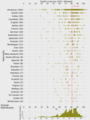
 Deaths in April 2018.png 2,471 × 3,298; 563 KB
-
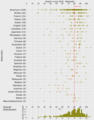
 Deaths in February 2018.png 2,471 × 3,298; 561 KB
-
 Deaths in January 2018.png 2,471 × 3,298; 591 KB
-
 Deaths in July 2018.png 2,536 × 3,298; 561 KB
-
 Deaths July 2018.png 2,536 × 3,241; 558 KB
-

-
 Deportivo La Dromclough stats as of march 3 2022.png 674 × 821; 126 KB
-
-
 Descr.png 1,400 × 1,051; 184 KB
-
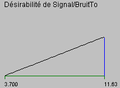 DesirabilitySignalNoise.png 205 × 150; 1 KB
-
 DesirabilityYmoy.png 202 × 158; 1 KB
-
 Destinos.png 900 × 506; 41 KB
-
 Deviation from Mean of a Random Distribution.jpg 560 × 420; 39 KB
-
 Dewiacja i dyspersja.png 564 × 274; 13 KB
-
 Diagrama de caja.jpg 865 × 494; 26 KB
-
 Diagramme en batons.png 379 × 248; 1 KB
-

-
 Dialectometry.jpg 772 × 723; 140 KB
-
 DiccionarioJeograficodeChileRisopatronPg 119.jpg 381 × 159; 19 KB
-
 DiccionarioJeograficodeChileRisopatronPg 120.jpg 717 × 497; 185 KB
-
 DiccionarioJeograficodeChileRisopatronPg 121.jpg 261 × 89; 10 KB
-
 DiccionarioJeograficodeChileRisopatronPg 122.jpg 493 × 447; 79 KB
-
 DiccionarioJeograficodeChileRisopatronPg 123.jpg 359 × 197; 46 KB
-
 DiccionarioJeograficodeChileRisopatronPg XVII A 01.jpg 368 × 147; 23 KB
-
 DiccionarioJeograficodeChileRisopatronPg XVII A 02.jpg 646 × 337; 89 KB
-
 DiccionarioJeograficodeChileRisopatronPg XVII A 03.jpg 351 × 177; 30 KB
-
 DiccionarioJeograficodeChileRisopatronPg XVII A 04.jpg 393 × 497; 70 KB
-
 DiccionarioJeograficodeChileRisopatronPg XVII A 05.jpg 348 × 616; 85 KB
-
 DiccionarioJeograficodeChileRisopatronPg XXII A 01.jpg 877 × 380; 121 KB
-
 DiccionarioJeograficodeChileRisopatronPg XXII A 02.jpg 878 × 255; 86 KB
-
 DiccionarioJeograficodeChileRisopatronPg XXII A 03.jpg 880 × 144; 41 KB
-
 Dinamika nisbi kəmiyyəti.png 1,364 × 767; 57 KB
-
 Direct relations.jpg 1,596 × 1,703; 158 KB
-
 Direct relationship.jpg 1,623 × 1,058; 128 KB
-
 Discrete concentration curve.png 4,637 × 2,640; 146 KB
-
 Distribución normal acumulada.png 1,259 × 590; 72 KB
-
 Distribution de Boltzmann en fonction de la température.png 567 × 324; 20 KB
-
 Distribution for rratio.png 932 × 664; 54 KB
-
 Distribution of 20000 sample means for first marriage.svg 809 × 309; 88 KB
-
 Distribution of 20000 sample means for runners.svg 809 × 309; 80 KB
-
 Distribution of 20000 sample means of size 16.svg 809 × 309; 75 KB
-
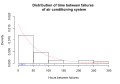 Distribution of AC failure times.svg 609 × 423; 70 KB
-
 Distribution of all possible sample means first marriage.svg 809 × 309; 109 KB
-
 Distribution of all possible sample means for runners.svg 809 × 309; 97 KB
-
 Distribution of sample means for 9732 women.svg 809 × 309; 70 KB
-
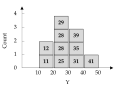 Distribution of Y.svg 510 × 378; 6 KB
-
 Distributions with equal medians.svg 540 × 350; 32 KB
-
 Dit is het divisionair maximum.png 800 × 590; 24 KB
-
 Divisionair Maximum Stap 1.png 284 × 292; 10 KB
-
 Divisionair maximum. Stap 6 De richtingscoëfficiënt.png 800 × 600; 43 KB
-
 DKW bounds.svg 360 × 288; 24 KB
-
 DOE mean plot of seven factors for bike speed.png 966 × 890; 75 KB
-
 DoitasunaEstaldura.svg 440 × 800; 40 KB
-
 Dollars 0.4 hours.svg 356 × 355; 55 KB
-
 Dollars for 0.4 hours.svg 356 × 355; 54 KB
-
 Dollars vs hours.svg 356 × 355; 50 KB
-

-
 DVS2017-Anzeigequote-Haushalt.png 1,554 × 1,020; 151 KB
-
 DVS2017-Anzeigequote-Personen.png 1,596 × 1,186; 157 KB
-
 DVS2017-Opferanteil-12Monate.png 1,646 × 1,086; 158 KB
-
 Dwa wymiary wypowiedzi.jpg 760 × 480; 132 KB
-
 Early survival.by year.no vandals.png 1,024 × 768; 27 KB
-
 Earth overshoot day.png 678 × 420; 177 KB
-
 Ebeling failure histogram.svg 496 × 294; 54 KB
-
 Ebeling Weibull survival function.svg 496 × 294; 60 KB
-
 EDA example - Always plot your data.jpg 929 × 986; 163 KB
-
 Effect of sample size on distribution of sample means.svg 744 × 309; 104 KB
-

-
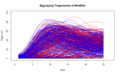 Egg Laying Trajectories of Medflies.png 861 × 532; 30 KB
-
 EITC vs LFPR USA.png 563 × 487; 26 KB
-
 Ejercicios estadistica.pdf 1,239 × 1,754, 64 pages; 525 KB
-
 Empirical Characteristic Function.jpg 373 × 310; 77 KB
-
 Empirical rule histogram.svg 553 × 548; 23 KB
-
 Empirical Rule.PNG 769 × 558; 30 KB
-
 Emplois par secteur en Laponie 2.jpg 751 × 648; 66 KB
-
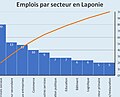 Emplois par secteur en Laponie.jpg 696 × 564; 45 KB
-
 Ensembl contigview.png 828 × 836; 66 KB
-
 Entwicklung der Schülerzahlen HSG seit 1990.svg 576 × 432; 29 KB
-
 Enwiki-degree-distribution.png 1,000 × 700; 45 KB
-
 Epanechnikov-Kernel.svg 594 × 224; 18 KB
-
 Equal interval classificatie.PNG 451 × 245; 6 KB
-
 EraNameStatistics.tif 1,741 × 653; 239 KB
-
 Eri maiden kokonaisveroasteita 2021.png 4,149 × 2,737; 209 KB
-
 Erwartungswert.png 783 × 771; 279 KB
-
 Esp USSR 1964 stat.jpg 654 × 1,094; 237 KB
-
 Esp USSR 1964 tepl.jpg 1,088 × 823; 142 KB
-
 Esp USSR 1964 xG.jpg 1,994 × 724; 199 KB
-
 Esquema castellà.jpg 929 × 707; 86 KB
-
 Estadistica de pai.png 550 × 279; 26 KB
-
 Estimación salario lin-log Kleiber & Zeileis 2008.jpeg 924 × 924; 92 KB
-
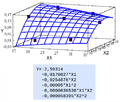 Estimated response surface2.png 1,082 × 916; 77 KB
-
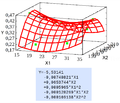 Estimated response surface3.png 1,078 × 926; 59 KB
-
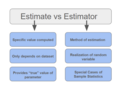 Estimator vs Estimate.png 711 × 531; 33 KB
-
 Ethanol fuel k-d tree.png 513 × 501; 60 KB
-
 ETIのグラフ.jpg 478 × 324; 22 KB
-
 EU Light Bulb Technology Market Share.svg 374 × 156; 85 KB
-
 Euler-Maruyama Leimkuhler-Matthews.gif 360 × 576; 340 KB
-
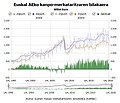 EUSTAT -Grafikoa Kanpo merkataritza.jpg 609 × 523; 58 KB
-

-

-
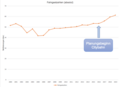
 Evolution fréquentation du Burning Man.png 1,906 × 940; 108 KB
-
 Evolution population bourg-en-lavaux.png 752 × 427; 43 KB
-
 Example AUC graph.png 399 × 368; 6 KB
-
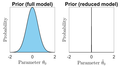 Example full and reduced priors.png 2,609 × 1,428; 95 KB
-
 Example Galbraith's radial plot.svg 749 × 675; 604 KB
-
 Example of 2-anonymity.png 1,975 × 771; 141 KB
-
 Example of CO2 H2S multi-GAS data.png 739 × 460; 27 KB
-
 Example of Thompson sampling.webp 640 × 480; 2.6 MB
-
 Exemplo de distribuição de frequência.png 397 × 202; 9 KB
-
 Exogenität.png 4,875 × 3,122; 232 KB
-
 Exogenitätsverletzung.svg 731 × 468; 98 KB
-
 Exp par.png 1,442 × 487; 12 KB
-
 Expected Value Statistics.tif 715 × 496; 1.01 MB
-
 ExpModel184.pdf 1,050 × 1,050; 56 KB
-
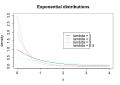 Exponential distribution PDFs with various lambda.svg 658 × 468; 60 KB
-
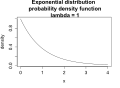 Exponential PDF lambda 1.svg 519 × 380; 46 KB
-
 Exponential probability density.svg 360 × 288; 28 KB
-
 Exponential survival functions.svg 635 × 354; 61 KB
-
 Exports-2018.png 1,450 × 629; 141 KB
-
 F-Distribution Table.png 931 × 306; 22 KB
-
 F-test plot.svg 540 × 360; 24 KB
-
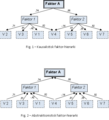
 FactorAnalysis SimpleModel.png 1,033 × 392; 25 KB
-
 FactorPlot.svg 590 × 407; 12 KB
-
 Fahrgastzahlen ESWE.png 708 × 515; 47 KB
-
 Faktorhierarkier.png 449 × 493; 11 KB
-
 False-Positive-and-False Negative Psych-Evaluation-Conclusions.png 694 × 357; 24 KB
-
 Falska p varden.jpg 429 × 363; 40 KB
-
 Fanchart-mathachieve.png 1,908 × 1,963; 244 KB
-
 FastKDE example.jpg 664 × 186; 87 KB
-
 Fb5 cover.jpg 1,154 × 910; 90 KB
-
 FedStat Court Res1.jpg 1,244 × 572; 229 KB
-
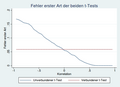 Fehler erster Art von t-Tests.png 598 × 435; 21 KB
-
 FI estimateurs de centre.jpg 960 × 2,880; 225 KB
-
 Figure 1 - Hyperbolastic Type I.png 568 × 235; 11 KB
-
 Figure 1 Average value versus Range.png 734 × 740; 20 KB
-
 Figure 2 - Hyperbolastic Type I.png 576 × 235; 12 KB
-
 Figure 3 - Hyperbolastic Type II.png 538 × 240; 10 KB
-
 Figure 4 - Hyperbolastic Type II.png 557 × 240; 9 KB
-
 Figure 5 - Hyperbolastic Type III.png 587 × 251; 7 KB
-
 Figure 6 - Hyperbolastic Type III.png 598 × 245; 13 KB
-
 Figure 7 - Hyperbolastic Type III.png 598 × 245; 11 KB
-
 Fisher Transformation.png 540 × 323; 6 KB
-

-
 Fisher's Polygenic Model.png 1,000 × 600; 39 KB
-
 Fisher-method-fused-P.svg 623 × 533; 342 KB
-
 Fisher2classes.png 640 × 480; 24 KB
-
 Fisherův kanonický směr.PNG 1,073 × 538; 26 KB
-
 Five number summary.png 672 × 141; 3 KB
-
 FM editor ratio over time en WP.png 880 × 507; 33 KB
-
 Four survival functions.svg 668 × 438; 79 KB
-
 FRANCE-language-students.png 907 × 464; 20 KB
-
 Frequency histogram and exclusive and inclusive percentiles 2.png 604 × 269; 12 KB
-
 Frequency histogram and exclusive and inclusive percentiles.png 450 × 680; 21 KB
-
 Frequency histogram and percentile ranks (PR) 2.png 270 × 213; 5 KB
-
 Frequency historgram and percentile ranks (PR).png 395 × 332; 7 KB
-
 Furness data table.png 260 × 197; 3 KB
-
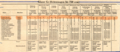
 G.R.Melidon Relațiune statistică 1862.jpg 562 × 937; 70 KB
-
 Gambling game optimal policy.png 1,324 × 697; 61 KB
-
 Gaussian kernel regression.png 504 × 352; 10 KB
-
 Gaussian Kernel Regression.png 507 × 346; 5 KB
-
 Gaussian process draws from prior distribution.png 1,200 × 400; 112 KB
-
 Gaussian Process Regression.png 1,200 × 400; 98 KB
-
 GaussianScatterPCA.svg 720 × 720; 515 KB
-
 Gazette.gif 571 × 456; 21 KB
-
 Geary example.png 1,600 × 1,600; 30 KB
-
 Generalized means + agm.png 640 × 480; 50 KB
-
 Generalized means of 1, x.svg 576 × 432; 39 KB
-
 Genome Assembly Statistics.png 6,640 × 2,888; 219 KB


.png)


_2.png)
.png)


.png)